Saturday, July 26, 2008

Star Plots

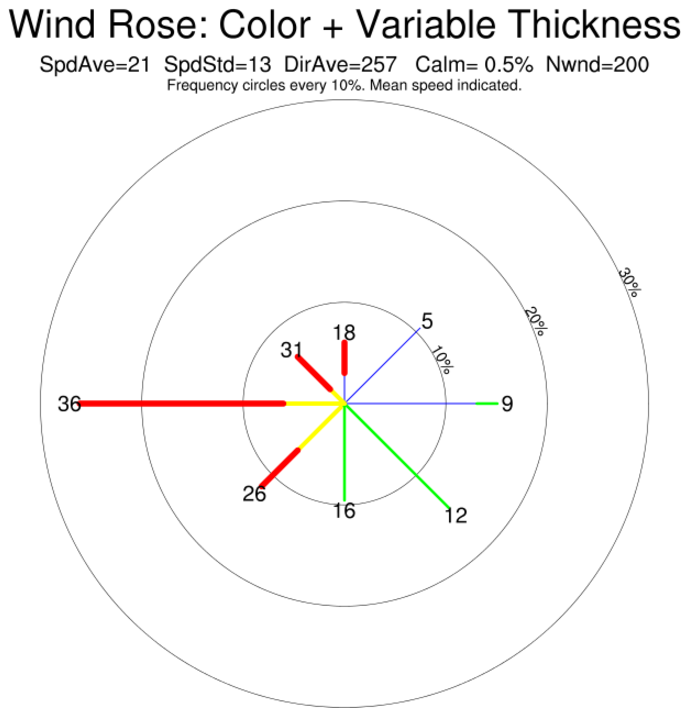
Radar or star plot of selected peak ratios from
gas chromatographic analysis of oil samples.
The star plot is a method of displaying multivariate data. Each star represents a single observation. Typically, star plots are generated in a multi-plot format with many stars on each page and each star representing one observation. Star plots are used to examine the relative values for a single data point and to locate similar points or dissimilar points.
http://www.humble-inc.com/app99-2-fig5-6.gif

Correlation Matrix

Pearson Correlation Coefficients / Significance / Number of Observations


The correlation matrix computes the correlation coefficients of the columns of a matrix. That is, row i and column j of the correlation matrix is the correlation between column i and column j of the original matrix. The diagonal elements of the correlation matrix will be 1 since they are the correlation of a column with itself. The correlation matrix is also symmetric since the correlation of column i with column j is the same as the correlation of column j with column i.

http://www.kltprc.net/policynotes/Gifs/Tab_005A_4.gif

Similarity Matrix


The following is the similarity score matrix at 250 PAM which is normally used to obtain a rough similarity score or a first alignment. by 2
A similarity matrix is a matrix of scores which express the similarity between two data points. The elements of a similarity matrix measure pairwise similarities of objects - the greater similarity of two objects, the greater the value of the measure. Similarity matrices are used in sequence alignment. Higher scores are given to more-similar characters, and lower or negative scores for dissimilar characters.


Stem and Leaf Plot


A stem-and-leaf plot is a display that organizes data to show its shape and distribution.In a stem-and-leaf plot each data value is split into a "stem" and a "leaf". The "leaf" is usually the last digit of the number and the other digits to the left of the "leaf" form the "stem". The number 123 would be split as: stem 12, leaf 3 . A stem-and-leaf plot does resemble a histogram turned sideways. The stem values could represent the intervals of a histogram, and the leaf values could represent the frequency for each interval. One advantage to the stem-and-leaf plot over the histogram is that the stem-and-leaf plot displays not only the frequency for each interval, but also displays all of the individual values within that interval.

Box Plot


This box plot, comparing four machines for energy output, shows that machine has a significant effect on energy with respect to both location and variation. Machine 3 has the highest energy response (about 72.5); machine 4 has the least variable energy response with about 50% of its readings being within 1 energy unit.

Box plots are an excellent tool for conveying location and variation information in data sets, particularly for detecting and illustrating location and variation changes between different groups of data. A boxplot is a way of summarizing a set of data measured on an interval scale. It is often used in exploratory data analysis. It is a type of graph which is used to show the shape of the distribution, its central value, and variability.
http://www.itl.nist.gov/div898/handbook/eda/gif/boxplot0.gif

Histogram

Distribution of salaries of the Acme Corporation
A histogram is used to graphically summarize and display the distribution of a process data set.
A histogram can be constructed by segmenting the range of the data into equal sized bins (also called segments, groups or classes). The vertical axis of the histogram is labeled Frequency (the number of counts for each bin), and the horizontal axis of the histogram is labeled with the range of your response variable. You then determine the number of data points that reside within each bin and construct the histogram. The bins size can be defined by the user, by some common rule, or by software methods.

Paqrallel Coordinated Graph

Candle Chart

A parallel coordinates graph connects a series of values. It can be used to visualize many dimensions in one graph.

Triangular Plot


Triangular plot of current election in the United Kingdom

The axes of the figure show the estimated fraction of the population intending to vote for each of the major parties; the white circle shows the current estimate from opinion polls. The coloured areas show the regions of the plot in which -- under the assumption of uniform national swing each of the corresponding major parties would win a majority in Parliament.

A triangle plot also known as a ternary plot, is a graph of 3 variables. It is most often used in geologic studies to show the relative compositions of soils and rocks, but it can be more generally applied to any system of three variables.
http://ex-parrot.com/~chris/images/20050407/triangle.png

Windrose


This wind rose is circular with each circle representing the percentage of time the wind blows from a particular direction. The mean wind speed is printed at the end of each directional line. The overall statistics for the entire data sample are included in the title.
A wind rose is a graphic tool used by meterologists to give a succinct view of how wind speed and direction are typically distributed at a particular location. Presented in a circular format, the wind rose shows the frequency of winds blowing from particular directions. The length of each "spoke" around the circle is related to the frequency that the wind blows from a particular direction per unit time. Each concentric circle represents a different frequency, emanating from zero at the center to increasing frequencies at the outer circles. A wind rose plot may contain additional information, in that each spoke is broken down into color-coded bands that show wind speed ranges. Wind roses typically use 16 cardinal directions, such as north (N), NNE, NE, etc., although they may be subdivided into as many as 32 directions.

Climograph


A climograph is a graphical depiction of the monthly precipitation and temperature conditions for a selected place. They are a valuable tool in studying climate, but also can be used to infer connections between climate and human conditions.

Population Profile


A population profile is a chart showing the number of people as a function of their ages. An analysis (often in graphical form) representing the extent to which something exhibits various characteristics.

Scatter Plots

This is a scatter plot of the initiation of braking points relative to target (start of maximal deceleration point in braking) for subjects riding the bike at different perceived velocities.


Scatter plots are similar to line graphs in that they use horizontal and vertical axes to plot data points. They allow you to visualize multivariate data of up to four dimensions. Scatter plots will often show at a glance whether a relationship exists between two sets of data.

Lorenze Curve


The Lorenz curve is a graphical representation of the proportionality of a distribution (the cumulative percentage of the values). To build the Lorenz curve, all the elements of a distribution must be ordered from the most important to the least important. Then, each element is plotted according to their cumulative percentage of X and Y, X being the cumulative percentage of elements and Y being their cumulative importance. The Lorenz curve is used in economics and ecology to describe inequality in wealth or size.

Standardized Choropleth Map


The standard choropleth technique is a method of cartographic representation that employs a distinctive colour or shading that is applied to predefined areal units . For example, the units can be census divisions or census tracts, and the areal symbols cover the entire geographic unit

Bivariate Choropleth Map


A bivariate map displays two variables on a single map by combining two different sets of graphic symbols or colors. A bivariate choropleth map uses color to solve a problem of representation in four dimensions; two spatial dimensions — longitude and latitude — and two statistical variables.

Unclassed Choropleth Map


Classed and unclassed frequency legend for different statistical distributions

In an unclassed map its logical to use frequency curves that varies the shading or color intensity from the lowest to the highest specified value. In a conventional unclassed map a continuous ramp of shading or color intensity is used.

Classed Choropleth Map


A choropleth map is a map with areas colored or shaded such that the darkness or lightness of an area symbol is proportional to the density of the mapped phenomena or is symbolic of the class/classification. In a classed map the main task is to determine height and shading or color intensity of the bar for each class

Isarithmic Map


The basics for Isarithmic mapping is that the cartographer selects a distinctive color or shading, and applies it to artificial collection units (chorograms). Chorograms are statistical or administrative areas. It is these chorograms that are "colored or shaded",i.i. the symbology is applied so that the map reader can see within which symbol class the chorogram belongs.

http://www.d.umn.edu/geog/cartfolder/Scott%27s%20Images/isarithmic-ex-2.jpg

Range Graded Proportional Circle Map


Range-graded scaling: The data are divided into groups, using classification procedures common to choropleth mapping. The design goal is for symbol size discrimination, rather than magnitude estimation. The cartographer chooses symbol sizes for adjacent classes so that the map reader can easily distinguish between circle sizes, and therefore, categories.

Continuously Variable Proportional Circle Map


A continuously variable proportional circle map is a proportional circle map which utilizes circles to create point data.

Digital Orthophoto Quarter Quadrangle (DOQQ)

This is a clipped portion of the NW quadrant of Union Springs, NY.
A digital orthophoto quadrangle (DOQ) is a computer-generated image of an aerial photograph in which image displacement caused by terrain relief and camera tilts has been removed. It combines the image characteristics of a photograph with the geometric qualities of a map. http://www.usgsquads.com/images/doqq_cir_unionsprg_small.jpg

Digital Elevation Model (DEM)

DEM map of Salt Lake City West, Utah
DEM uses Geographic Information System (GIS) technology to create, manipulate and analyze spatial data. A digital elevation model (DEM) is a digital representation of ground surface topography or terrain. It is also widely known as a digital terrain model (DTM). A DEM can be represented as a raster. DEMs are commonly built using remote sensing techniques, however, they may also be built from land surveying. DEMs are used often in geographic information systems, and are the most common basis for digitally-produced relief maps. Digital elevation models may be prepared in a number of ways, but they are frequently obtained by remote sensing rather than direct survey. The quality of a DEM is a measure of how accurate elevation is at each pixel (absolute accuracy) and how accurately is the morphology presented (relative accuracy).
http://edc2.usgs.gov/geodata/images/saltlake.gif

Digital Line Graphs (DLG)

DLG map of 1:2,000,000-Scale DLG data of the Illinois and Missouri States.
DLGs - Digital Line Graphs produced by the United States Geological Survey. DLGs consist of several layers of 1:24,000 map scale (vector) data for each USGS defined quad: boundaries, hydrography, vegetative surface cover, non-vegetative features, roads and trails, railroads, pipe and trans lines, and manmade features. Also included in this dataset is a hypsography (elevation contour) layer, nine layers in all. Data are projected in UTM coordinates using datum NAD83.
http://edc2.usgs.gov/geodata/images/hydro.gif

Digital Raster Graphics


Digital raster graphic (DRG) is a scanned image of a U.S. Geological Survey (USGS) standard series topographic map, including all map collar information. The image inside the map neatline is georeferenced to the surface of the earth and fit to the Universal Transverse Mercator projection. The horizontal positional accuracy and datum of the DRG matches the accuracy and datum of the source map. The map is scanned at a minimum resolution of 250 dots per inch.
http://gpsinformation.net/main/tr-drg.gif

Isopach

Isopach Map of Holocene Overburden
Isopach is a line on a map drawn through points of equal thickness of a designated unit (such as a coal bed).http://seeps.geol.ucsb.edu/images/pictures/geology_images/isopach_fast.jpg

Isohyet


Isohyet is a line drawn on a weather map connecting points that receive equal amounts of precipitation during a given period of time.
http://www.nwl.ac.uk/ih/nrfa/spatialinfo/Rainfall/rainfall002001e.jpg

Isopleth


Isopleth are defined as lines connecting pots on a map having same numerical value. An isopleth is a feature of meteorological charts, connecting points which have an equal value of some variable at a given time and spatial area.
http://www.cimms.ou.edu/~doswell/sfcanal/Fig_5c.GIF

Isotachs


Isotachs are lines on a given surface connecting points with equal wind speed. The isotachs, or wind speeds, are measured in knots. They are found by looking at the yellow numbers that coincide with the dashed yellow lines (the numbers and lines are red on the white background maps). Isotachs- These are lines of equal wind speed. They are most often contoured in the upper levels of the atmosphere, especially at the jet stream level. They are important for locating the jet stream and jet streaks within a jet stream.
http://wxmaps.org/pix/avnmr5.00hr.png

Isobars


An isobar is a line of equal or constant barometric pressure on a graph, plot, or map. In meteorology, the barometric pressures shown are reduced to sea level, not the surface pressures at the map locations. The distribution of isobars is closely related to the magnitude and direction of the wind field, and can be used to predict future weather patterns. line of constant pressure. Isobars are found ONLY on surface charts. They most commonly connect lines of equal pressure in the units of millibars. High pressure isobars generally occurs with isobars above 1010 mb while low pressure isobars occur with lower than 1010 millibars. Isobars "kink" along fronts and otherwise have a smooth curved trajectory. Isobars represent the pressure at zero geopotential meters. This is done to compensate for elevation changes. Isobars of close proximity represent higher wind speeds than isobars of wide spacing. When isobars are "pack together", this represents an increase in the pressure gradient force and thus stronger winds.
http://www.windfinder.com/grafiken/isobars/isobars_central_europe_1.gif

LIDAR


3-D Forest Mapping with LIDAR

LIDAR (Light Detection and Ranging) is a way to map the surface of the earth with more accuracy. LIDAR, or light detection and ranging, provides much more detailed information about the particular landscape than does an aerial photograph.
http://i.treehugger.com/images/2007/10/24/lidar%20map-jj-001.jpg

Doppler Radar Map


Doopler radar is a key forcasting tool. Objects in the air, such as raindrops, snow crystals, hailstones or even insects and dust, scatter or reflect some of the radio waves back to the antenna. All weather radars, including Doppler, electronically convert the reflected radio waves into pictures showing the location and intensity of precipitation. Doppler radars also measure the frequency change in returning radio waves. Waves reflected by something moving away from the antenna change to a lower frequency, while waves from an object moving toward the antenna change to a higher frequency.
http://www.wbir.com/weather/graphics/radar/tys_radar.jpg

Black and White Aerial Photograph


Black & White aerial photo of South of Bloomsburg


Cartographers and planners take detailed measurements from aerial photos in the preparation of maps. Trained interpreters utilize arial photos to determine land-use and environmental conditions, among other things. Black and white emulsion sensitive to approximately the
same wavelengths as the human eye.
http://www.fas.org/irp/imint/docs/rst/Sect21/BloomAerial4.JPG

Infrared Aerial Photo

Infrared aerial photo of the Sacramento Deep Water Channel
Infrared aerial photography can be used to document changes to the environment, the health of forests, wetlands, bays and oceans and can also be used to document and monitor such items as damage to roofs, the tracking of dairy farm out flows, pinpointing the source of, and monitoring, insect or disease infested vineyards, or sites contaminated by toxic chemicals, and many more applications.
http://www.aerialarchives.com/imagedb/IR0010154f.jpg

Cartographic Animations


Cartographic Animation of hurricane katrina
The basic goal of cartographic animation is the depiction of change. The types of change can be categorized as temporal and non-temporal. Most cartographic animations depict change over time. Non-temporal cartographic animation are also possible. Examples include animations of data classification, data generalization, and a series of related variables from a single time period.
http://www.spc.noaa.gov/misc/carbin/katrina/kat5_1945.gif

Statistical Map


Statistical Map of Wetlands Reserve Program


Statistical maps which are used to display the distribution of a variable over a geographic area, usually defined by political boundaries.
In a statistical map, each unit is illustrated by a shading pattern or color that represents the value, or range of values for that unit of the variable. The shading density or the color changes from one value or range of values to another value or range of values. The statistics shown on are expressed as rates, ratios, percentages, or other statistical measures and indices, not absolute numbers or totals. Yet, no matter what statistical measure or index is used, values in the distribution must be mutually exclusive and exhaustive.
http://www.nrcs.usda.gov/programs/wrp/photos/ca_primeFar.gif

Cartogram


This cartogram and map show the locations of some of the major cities of the United Kingdom.
Cartogram: is a small diagram, on the face of a map, showing quantitative information. It is usually an abstracted and simplified map which is not true to scale.
http://www.sasi.group.shef.ac.uk/publications/pandpimages/g00_cities_locator.jpg

Flow Map


Compressor Flow Maps used to help anyone who is interested in turbo charging their car or upgrading their factory turbo to a bigger unit.
Cartographers have long used flow maps to show the movement of objects from one location to another, such as the number of people in a migration, the amount of goods being traded, or the number of packets in a network. The advantage of flow maps is that they reduce visual clutter by merging edges. Most flow maps are drawn by hand and there are few computer algorithms available.
http://www.automotivearticles.com/uploads/flow_map.jpg

Isoline Map


Isoline map of annual runoff depth
An isoline map is a map with continuous lines joining points of the same value. Examples would be equal altitude (contour lines), temperature (isotherms), barometric pressure (isobars), wind speed (isotachs), wind direction (isogon), wind shear (isoshear), etc. Isoline mapping is used to interpret the information on some thematic maps.
http://www.unu.edu/unupress/unupbooks/80157e/80157E0T.GIF