Friday, June 27, 2008

KML Remote Sensing


2005 Coral Reef Watch Maximum CompositeImage/Maximum Sea Surface Temperature

Wednesday, June 18, 2008

Proportional Circle Map


Proportional Circle maps have better pattern recognition. In a proportional circle map the size of the circle represents some value, such as population density.

Choropleth Map


A choropleth map is a thematic map in which areas are shaded or patterned in proportion to the measurement of the statistical variable being displayed on the map, such as population density or per capita income. It provides an easy way to visualize how a measurement varies across a geographic area.
Distribution can be shown as a dot distribution map. These show population concentrations well but can give the impression some areas have no people.


The dot-distribution maps portray quantitative data as a dot which represents a number of the phenomenon found within the boundary of a geographic area. The pattern of distributed dots reflects the general locations where the phenomenon was most likely to occur. The pattern and number of dots within a geographic area reveal the density of the phenomenon.


http://www.bbc.co.uk/scotland/education/bitesize/standard/img/geography/population/g155.gif

Japanese propaganda caricature map from around 1941, depicting a U.S. blockade of Japan from the Philippines which at that time was a United States possession.

A Propaganda map is a map that has persuasive communications directed at a specific audience designed to influence the targeted audience's opinions, beliefs and emotions in such a way as to bring about specific, planned alterations in their behavior.


Hypsometric Map

Hypsometric maps are maps that have elevations by contours, or sometimes by means of shading, tinting, or batching. Hypsometric maps represent the elevation of the terrain with colors. The area between two neighboring contour lines receives one specific tint.

PLSS Map


PLSS map of Alabama.
The Public Land Survey System (PLSS) is a way of subdividing and describing land in the United States. The PLSS is a rectangular survey system that typically divides the land into 6-mile square townships, which are further subdivided into 1-mile square sections.

Cadastral Map


GIS cadastral data is the compilation of land records information into a continuous map of a jurisdiction, typically a county. Cadastral map content should be detailed and complete
Cadastral map data should be compiled and constructed using coordinate geometry and precision placement techniques whenever possible. Attributes are as important as spatial information when used to support business decisions. Care should be taken to respect the privacy policies of the jurisdiction dealing with cadastral attribute information


http://www.irlandeses.org/imagenes/sanpedromap.jpg

Thematic Map


Thematic maps are data maps of a specific subject or for a specific purpose. They show the spatial distribution of one or more specific data themes for standard geographic areas.


http://www.statcan.ca/english/mapsgeo/images/landcover_eng.gif


Topographic Map


This is a topographic map with contour lines. Topographic maps are usually characterized by large-scale detail and cultural and natural features.


Planimetric map

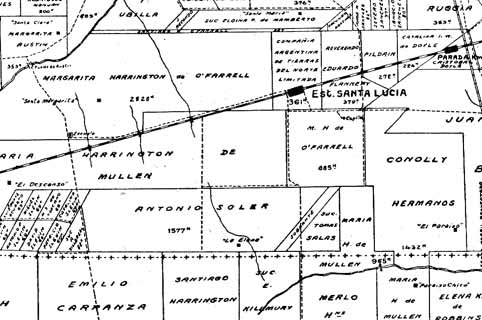
This is a black and white planimetric map of Lake George. It includes a wide range of information including transportation data, roads, major trails, railroads, airfields and ferry lines.
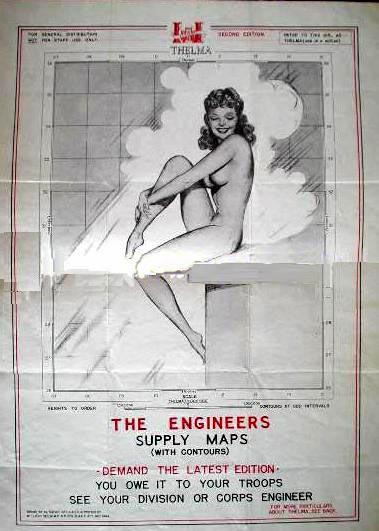
http://www.nysgis.state.ny.us/mapssales/gifs/lakegeo.jpg