Thursday, August 7, 2008

Nominal Choropleth Map


A nominal choropleth map is a map that displays a unique value.

Bilateral graph

This a bilateral graph is a graph that shows two differnt variables.

Unstandardized Choropleth Map


Total water use per day by state in the United States
Unstandardized Choropleth maps portray data without averaging within specified units. The data is presented as a total raw value

Univariate Choropleth Map

This univariate choropleth map shows the
percentasge of individuals living in poverty by county in the United States.

A univariate choropleth map is a choropleth map that displays a single attribute.


http://www.biomedcentral.com/content/figures/1471-2342-6-12-5.jpg

Index Value Plot

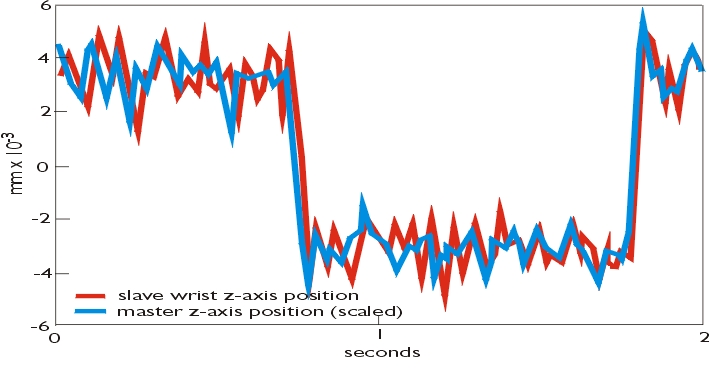
Time series plot of real-time streamflow compared
to historical streamflow for the day of the year (North Carolina)

An index value plot is visualization map which is plotted on a line graph.

http://water.usgs.gov/waterwatch/regplots/real/real_nc_1.gif

Saturday, July 26, 2008

Star Plots

Radar or star plot of selected peak ratios from
gas chromatographic analysis of oil samples.
The star plot is a method of displaying multivariate data. Each star represents a single observation. Typically, star plots are generated in a multi-plot format with many stars on each page and each star representing one observation. Star plots are used to examine the relative values for a single data point and to locate similar points or dissimilar points.
http://www.humble-inc.com/app99-2-fig5-6.gif

Correlation Matrix

Pearson Correlation Coefficients / Significance / Number of Observations


The correlation matrix computes the correlation coefficients of the columns of a matrix. That is, row i and column j of the correlation matrix is the correlation between column i and column j of the original matrix. The diagonal elements of the correlation matrix will be 1 since they are the correlation of a column with itself. The correlation matrix is also symmetric since the correlation of column i with column j is the same as the correlation of column j with column i.

http://www.kltprc.net/policynotes/Gifs/Tab_005A_4.gif